2011 election of council members in the Stevenage Borough Council
Elections to Stevenage Council were held on 5 May 2011. One third of the council stood for election; the seats which were last contested in 2007 . There were no changes from 2007.
After the election, the composition of the council remained as:
Labour 27 Conservative 9 Liberal Democrat 3 Election result Stevenage Local Election Result 2011 Party Seats Gains Losses Net gain/loss Seats % Votes % Votes +/− Labour 11 0 0 0 84.6 46.8 12,015 +10.9 Conservative 1 0 0 0 7.7 31.2 8,011 -3.7 Liberal Democrats 1 0 0 0 7.7 10.3 2,649 -11.6 UKIP 0 0 0 0 0 10.0 2,576 +3.7 TUSC 0 0 0 0 0 1.2 312 +1.2 Green 0 0 0 0 0 0.4 114 +0.4
Ward results Bandley Hill Location of Bandley Hill ward Bandley Hill Party Candidate Votes % ±% Labour Jackie Hollywell 919 47.3 +8.7 Conservative Sharon Hearn 642 33.0 -2.5 UKIP Angela Denness 203 10.4 +1.2 Liberal Democrats Barbara Segadelli 118 6.1 -10.5 TUSC Mark Pickersgill 61 3.1 +3.1 Majority 277 14.3 +11.2 Turnout 1,943 39.9 -21.6 Labour hold Swing
Bedwell Location of Bedwell ward Bedwell Party Candidate Votes % ±% Labour Liz Harrington 1,107 56.7 +16.9 Conservative Ellin Joseph 421 21.6 -5.0 UKIP Sean Howlett 258 13.2 -1.8 Green Ian Cropton 114 5.8 +5.8 TUSC Steve Glennon 53 2.7 +2.7 Majority 686 35.1 +21.9 Turnout 1,953 39.8 -20.2 Labour hold Swing
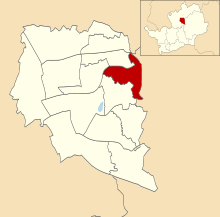
Chells Location of Chells ward Chells Party Candidate Votes % ±% Labour Howard Burrell 986 48.0 +8.9 Conservative Matthew Wyatt 517 25.1 -5.9 Liberal Democrats Tim Neale 299 14.5 -15.4 UKIP Rachalle Sainsbury 254 12.4 +12.4 Majority 469 22.8 +14.7 Turnout 2,056 41.9 -23.3 Labour hold Swing
Longmeadow Location of Longmeadow ward Longmeadow Party Candidate Votes % ±% Labour Monika Cherney-Craw 835 41.9 +7.5 Conservative Michelle Calcutt 723 36.3 -1.2 Liberal Democrats Ralph Baskerville 195 9.8 -9.6 UKIP Vicky Gabriel 177 8.9 +0.1 TUSC Helen Kerr 62 3.1 +3.1 Majority 112 5.6 +2.5 Turnout 1,992 44.5 -22.7 Labour hold Swing
Manor Location of Manor ward Manor Party Candidate Votes % ±% Liberal Democrats Robin Parker 982 41.3 +0.4 Labour Joseph Sherry 616 25.9 +5.5 Conservative Susan Smith 610 25.7 -7.1 UKIP Julie Seddon 168 7.1 +1.1 Majority 366 15.4 +7.3 Turnout 2,376 47.6 -23.4 Liberal Democrats hold Swing
Martins Wood Location of Martins Wood ward Martins Wood Party Candidate Votes % ±% Labour Sarah Walker 929 47.9 +15.8 Conservative Bill Whelan 690 35.6 -1.0 UKIP Pat Jones 189 9.7 +1.4 Liberal Democrats Kevin Aylward 131 6.8 -11.8 Majority 239 12.3 +7.8 Turnout 1,939 41.8 -20.5 Labour hold Swing
Old Town Location of Old Town ward Old Town Party Candidate Votes % ±% Labour Hugh Tessier 1,219 47.7 +11.0 Conservative Catherine Bibby 946 37.0 -1.7 UKIP Bernard Maddox 197 7.7 +1.1 Liberal Democrats Matthew Snell 196 7.7 -10.3 Majority 273 10.7 +8.7 Turnout 2,558 43.1 -23.0 Labour hold Swing
Pin Green Location of Pin Green ward Pin Green Party Candidate Votes % ±% Labour Jeannette Thomas 949 50.8 +9.9 Conservative Ted Jones 595 31.9 +0.9 UKIP Kevin Flavell 198 10.6 +4.2 Liberal Democrats Scott Copsey 126 6.7 -10.2 Majority 354 19.0 +9.1 Turnout 1,868 41.2 -21.9 Labour hold Swing
Roebuck Location of Roebuck ward Roebuck Party Candidate Votes % ±% Labour John Gardner 915 48.9 +11.7 Conservative Harvey Page 618 33.1 -0.1 UKIP Roy Worden 274 14.7 +4.4 TUSC Bryan Clare 61 3.3 +3.3 Majority 297 15.9 +11.9 Turnout 1,868 40.1 -21.9 Labour hold Swing
Shephall Location of Shephall ward Shephall Party Candidate Votes % ±% Labour Ann Webb 887 54.4 +12.9 Conservative Anita Speight 366 22.4 -6.0 UKIP Maureen Dilley 155 9.5 -1.9 Liberal Democrats Nicholas Baskerville 149 9.1 -9.6 TUSC Barbara Clare 75 4.6 +4.6 Majority 521 31.9 +18.8 Turnout 1,632 37.0 -21.0 Labour hold Swing
St Nicholas Location of St Nicholas ward St Nicholas Party Candidate Votes % ±% Labour Ralph Raynor 959 52.8 +11.4 Conservative Gillian Mould 501 27.6 -4.6 Liberal Democrats Heather Snell 181 10.0 -11.9 UKIP Ken Neal 176 9.7 +9.7 Majority 458 25.2 +16.0 Turnout 1,817 40.8 -20.4 Labour hold Swing
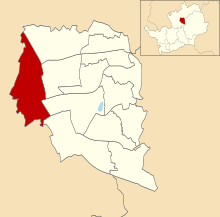
Symonds Green Location of Symonds Green ward Symonds Green Party Candidate Votes % ±% Labour David Kissane 1,120 58.4 +16.0 Conservative Paul Mould 539 28.1 -10.4 UKIP Carol Knowles 145 7.6 +7.6 Liberal Democrats Clive Hearmon 115 6.0 -13.1 Majority 581 30.3 +26.4 Turnout 1,919 43.1 -21.4 Labour hold Swing
Woodfield Location of Woodfield ward Woodfield Party Candidate Votes % ±% Conservative Graham Clark 843 48.0 -4.8 Labour Stephen Pattison 574 32.7 +8.3 UKIP Marion Mason 182 10.4 +10.4 Liberal Democrats Katherine Lloyd-Manning 157 8.9 -13.9 Majority 269 9.6 -18.8 Turnout 1,756 42.5 -24.7 Conservative hold Swing
References


 Council elections in Hertfordshire


